Site Speed
Since 2018 Google has started to penalise websites in search results if their pages do not meet their site speed criteria. It is therefore critical that all sites we produce are built to be as efficient as possible, ensuring they rank well on search engines.
PageSpeed Insights
The simplest way to test the speed of a site is to use Google's own tool - PageSpeed Insights. This is a website which allows you to test a specific URL and will return the results for both mobile and desktop devices.
There are two sections to the report - Core Web Vitals and Lab Results. Both sections contain information on how the scores are determined, helping you to optimise the site.
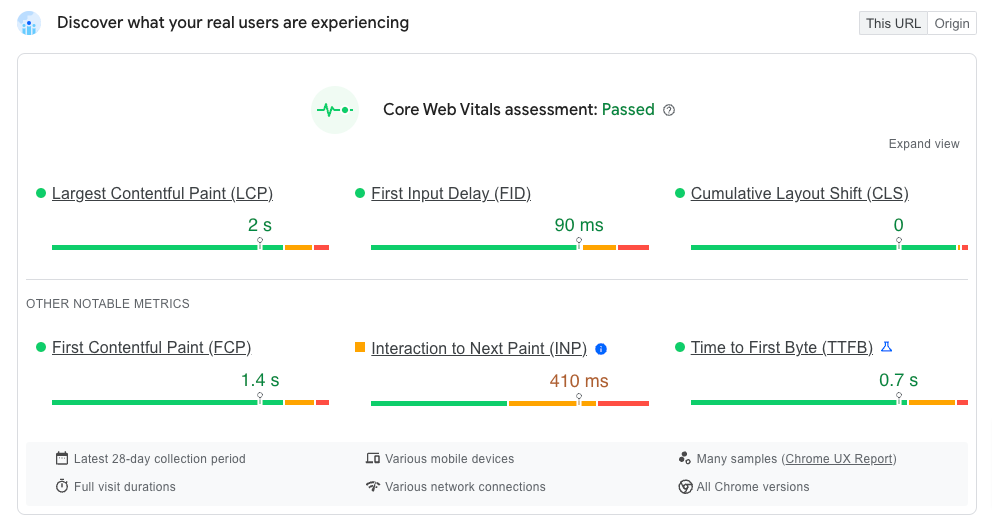
Core Web Vitals
This section is the most important, and determines whether or not your site will be penalised by Google. The results of this section are made up by real user statistics, so this is a representation of what your actual users experience.
Each metric uses a traffic light system to display how your site fares. In order to pass the Core Web Vitals you must be in green for all of the key results.
Mobile and desktop have two separate scores. It is very common for desktop to have a higher score than mobile, as traditionally desktop users use faster internet connections (fixed vs mobile) and generally have better performance from their device. Most of our sites have a very large proportion of mobile visitors, so it's imperitive we ensure the mobile score is as close to desktop as possible.

There are currently three key areas which are used to create the SiteSpeed score - LCP, FID and CLS. The report also provides three additional notable metrics, which can be used to improve the score.
In March 2024 First Input Delay will be replaced by Interaction to Next Paint as a key metric
Largest Contentful Paint (LCP)
LCP is a very important metric for measuring perceived load speed, because it marks the point in the page load timeline when the page's main content has likely loaded.
First Input Delay (FID)
FID measures load responsiveness because it quantifies the experience users feel when trying to interact with unresponsive pages. FID will be replaced by Interaction to Next Paint (INP) as a Core Web Vital in March 2024.
Cumulative Layout Shift (CLS)
CLS is a user-centric metric for measuring visual stability because it helps quantify how often users experience unexpected layout shifts - how often the page jumps as it loads.
First Contentful Paint (FCP)
FCP is used to measure perceived load speed because it marks the first point in the page load timeline where the user can see anything on the screen.
Interaction to Next Paint (INP)
INP assesses responsiveness using data from the Event Timing API. When an interaction causes a page to become unresponsive, that is a poor user experience. INP observes the latency of all interactions a user has made with the page, and reports a single value which all (or nearly all) interactions were below.
Time to First Byte (TTFB)
TTFB is a foundational metric for measuring connection setup time and web server responsiveness in both the lab and the field. It helps identify when a web server is too slow to respond to requests.
Lab Results
The second section of the report is generated using a mid-low tier emulated device (currently Moto G Power) with slow 4G throttling. This will give an indication of how your site would fare on a slower device, and more clearly accentuates the pain-points. It is very common to see a score in red here, as all of our sites use a lot of third-party apps which can greatly affect the performance on slower devices. That does not mean however that we shouldn't try to get the score as high as possible.
Similar to the Core Web Vitals, the lab results summarise the various scores using a traffic light system, however there is also a score out of 100 to summarise the page as a whole. Clients often focus on this one score, however it's important to inform them that this doesn't actually affect the page ranking.
You should use these scores as a guide to optimise the page. More in-depth information is provided below these scores, with the ability to filter out relevent audits for each section. This allows you to quickly focus in on specific areas for improvement.
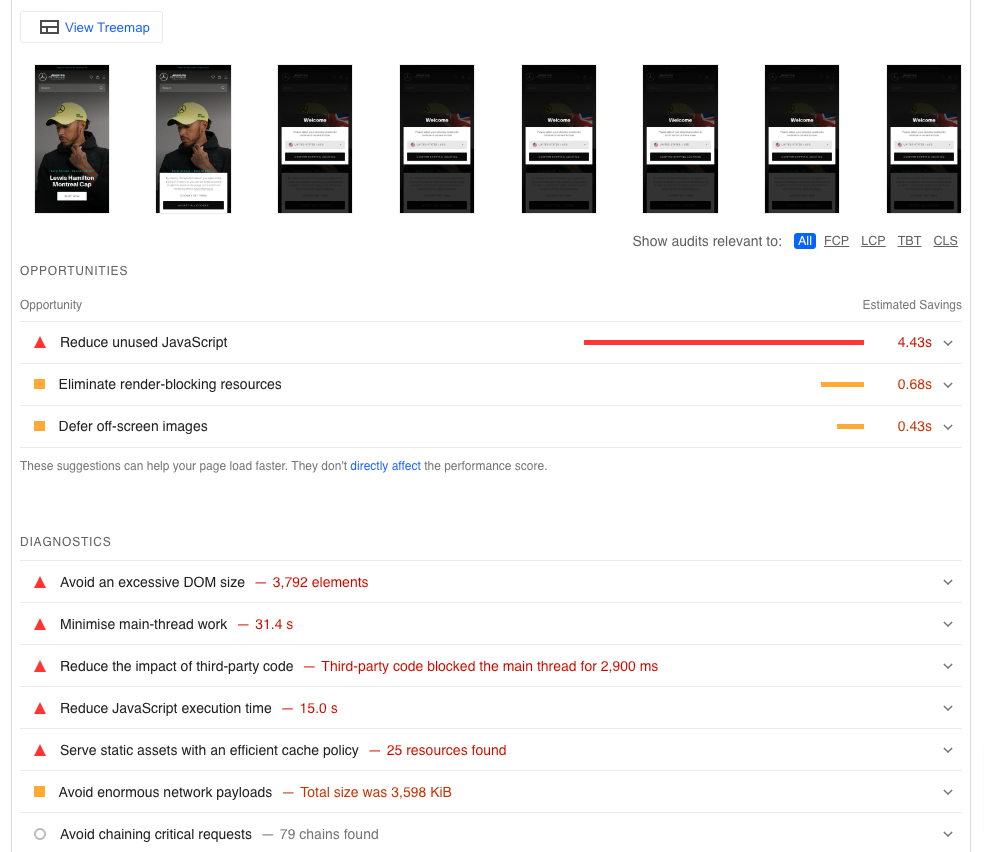
The final section shows a timeline of how the page loaded, then a list of opportunities for improvements and diagnostics for current issues.
Fixing the highlighted opportunities and diagnostics can help to improve the site speed score, however it's important to note that these areas don't directly affect the performance score.
You should expand each section and read the description of the issue - it will highlight specific images, files or sections of the page which are causing the most harm. You can then look to optimise these sections - whether it be reducing the amount of code they generate, improving JS performance, correctly sizing images, or in some cases lazy-loading the section.
Lazy-loading sections can increase the score, however it should be used as a last resort. If a section is causing a performance issue lazy-loading it will simply defer the issue, it does not resolve it. You should always aim to improve the performance first, and if it is still causing an issue you can then look to lazy-load it.